The Boston-based heavy-civil contractor has in its arsenal versatile machines that excavate earth, develop sites, manage snow and ice. But as the business entered its 50th year, it realized the need for one more tool, quite different from the usual set of hard heavy gears, one that could help them become efficient excavators, even strike gold through superior cash flows and margins.
Operations, strategy, and IT departments were confronted with everyday questions that required immediate answers. However, the answers usually showed up once in a month through manually-built Excel reports. The reports helped the managers review the activities of the previous month, and to some extent support planning for the following month. But they proved incapable of providing real-time insights. As a result, tracking daily operations, managing cash flows, and predicting future projects were largely based on guesswork rather than data.
Trigent recognized that the problem wasn’t just delayed reporting. Otherwise, the work could have been simply recreating the Excel reports in Power BI. But even the business logic upon which the reports were founded were fragmented in nature.
Added to the challenge were half-finished Power BI dashboards and unstable Fabric implementation, which needed to resume following the client’s exit from a troubled relationship with a previous tech vendor.
Trigent was requested to use a single Power BI lane to meet the concurrent asks of multiple departments without jeopardizing committed delivery dates.
The reporting modernization must happen without forcing a big-bang change.
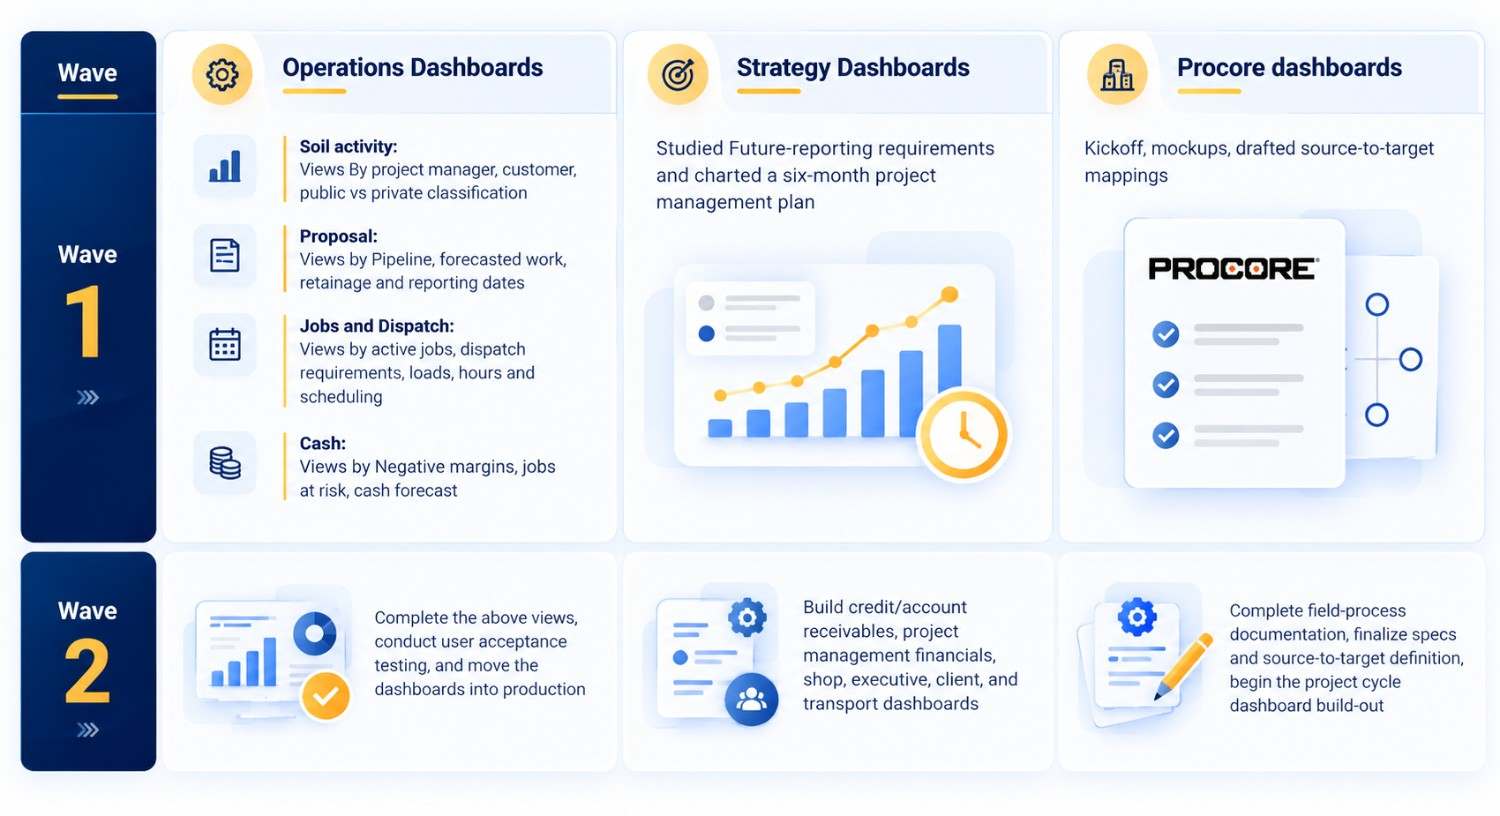
Trigent adopted a wave framework to tackle the different reporting requests from multiple departments. While the half-done operational dashboards needed a reboot, the broader management dashboard program involved work from the ground up, requiring a business-first discovery with the leaders and validation of source-to-target data mapping (STM).
Additionally, the team, having recently adopted Procore software, wished to analyze the project-cycle progress, which required a separate process discovery, source-data analysis, and metric definition before dashboard development. The concurrent requests from three reporting workstreams were grouped into two manageable waves.